CoolServant
Followers
About Me
CoolServant
View my complete profile
Powered by
Blogger
.
Cool Excel Assignment
Wednesday, October 13, 2010 | By CoolServant
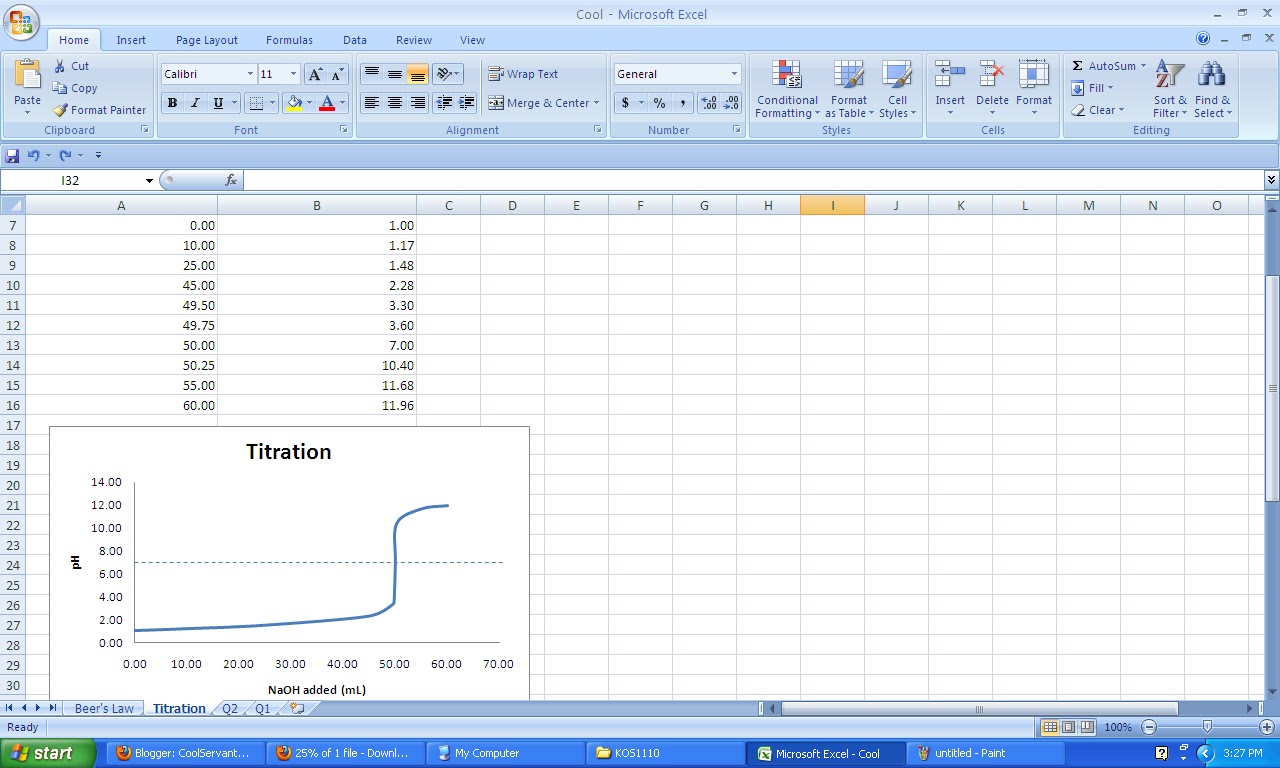
Our first assignment using Microsoft Excel 2007.....It's about recording data,plotting graph and analyzing data.
For example: We use excel to plot the graph for the following data;
NaOH Added(mL)
pH
0.00
10.00
25.00
45.00
49.50
50.00
50.25
55.00
60.00
Titration Graph
Beer's Law
For those who are still blurr about Microsoft excel .....clink the link below....you can't excel without excel
master excel in a blinkl
0 comments:
Post a Comment
Newer Post
Older Post
Home
Blog Archive
▼
2010
(6)
▼
October
(5)
XML is fun!!!
CoolChemsketch 2nd version
Cool PDB (Protein Database) Project
Cool Excel Assignment
CoolChemsketch - SMILE Structure
►
September
(1)


0 comments:
Post a Comment